But that was in October...
I did start this project in October, but have had various other projects and things going on so this kept getting pushed back. I had done some analysis awhile ago but never finished and never wrote it up. Well recently I started trying to give myself deadlines for my personal projects to get myself motivated to work on them. I also had some motivation because by finishing this before college nationals I can reuse the code to compare the data from club to college nationals.
Data Collection
I used t (found here) which is a bash command line utility that scrapes Twitter's using it's API. With that I was able to pull two sets of data for this analysis. First was all the tweets by Ultiworld's live account during nationals weekend. Second was all tweets during nationals weekend with the hashtag #NationalsTX. After collecting these datasets I did some analysis on them.
Basic Statistics
By looking at the distribution of tweets per days you can see that #NationalsTX is actually pretty consistent most days where as Ultiworld's Live account drops off as there become fewer games per day. This makes sense because the live account is only tweeting game updates and those become less frequent, where as the #Nationals becomes more popular per game because the games become higher stakes.
| Ultiworld Live | #NationalsTX | |
|---|---|---|
| Total Tweets | 1216 | 3157 |
| Day 1 | 407 | 744 |
| Day 2 | 440 | 872 |
| Day 3 | 237 | 762 |
| Day 4 | 132 | 779 |
| Unique Screen Names | 1 | 964 |
Charts
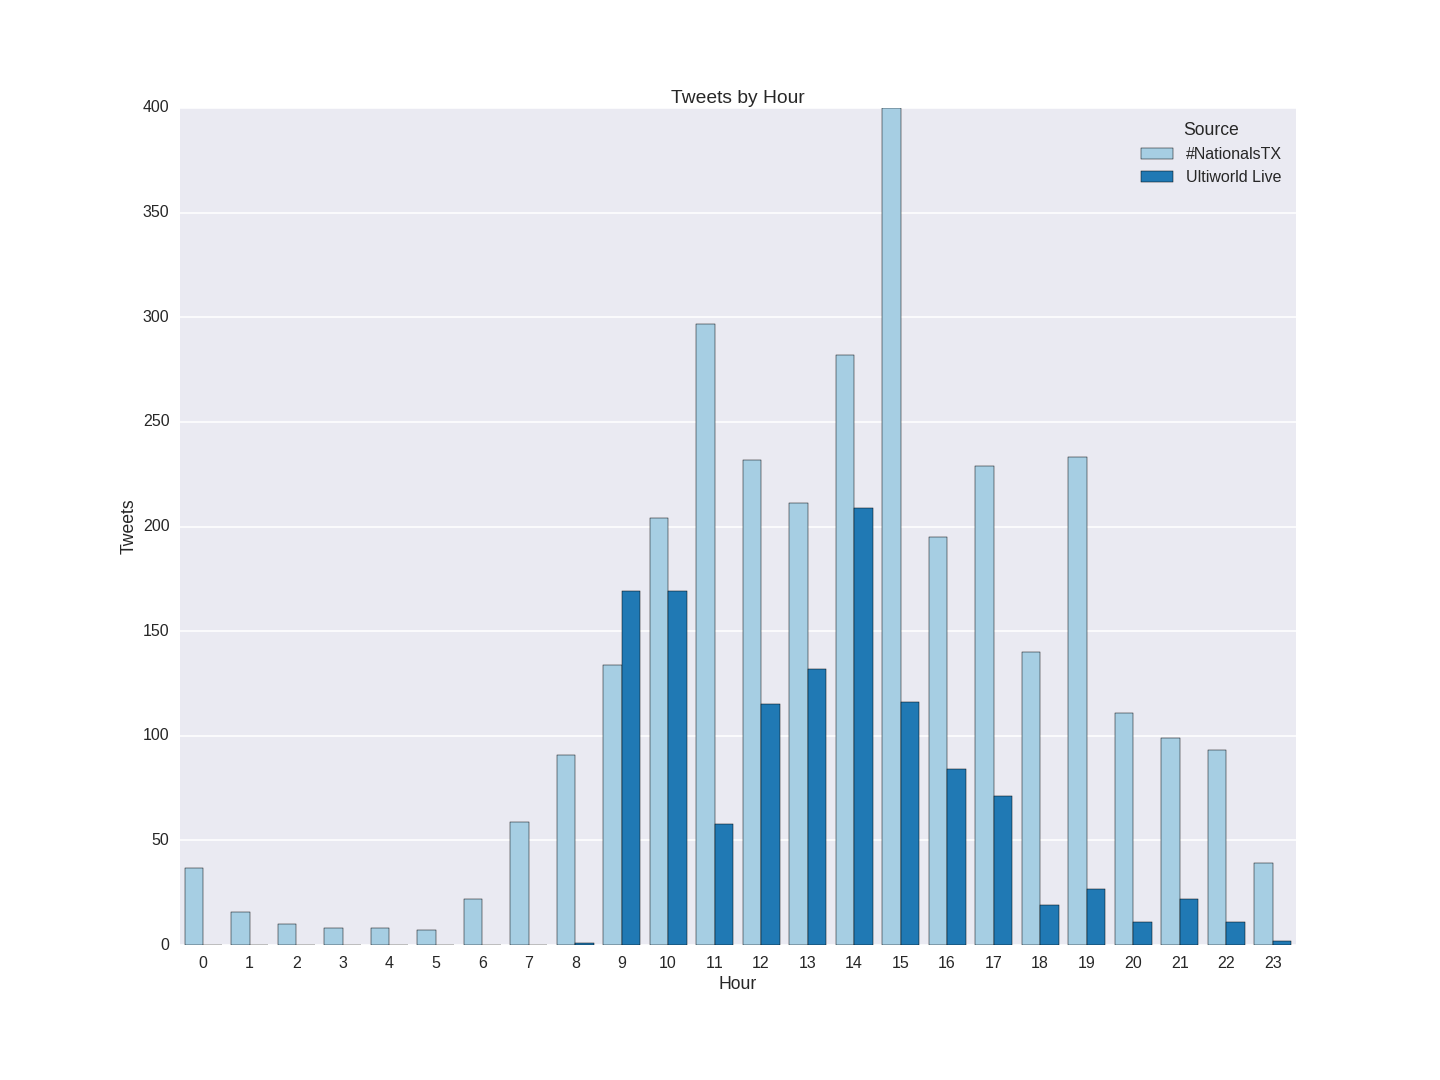
The first plot I made is of the tweets per hour by source. This shows how Ultiworld's coverage is pretty uniform throughout the day rise and falling during game times, but the general nationals tweets are more volatile and are more likely to line up with more exciting games and be later in the day when more results are being posted.
The second plot I made is of the number of tweets per 20 minutes, by day. With this plot you can actually see where certain games happen. I decided to match up big events and spikes in the graph and you can see by where I put annotations on the graph they all line up to a major game. For instance the biggest spike in tweets for both data sets was, unsurprisingly, when GOAT beat Revolver.
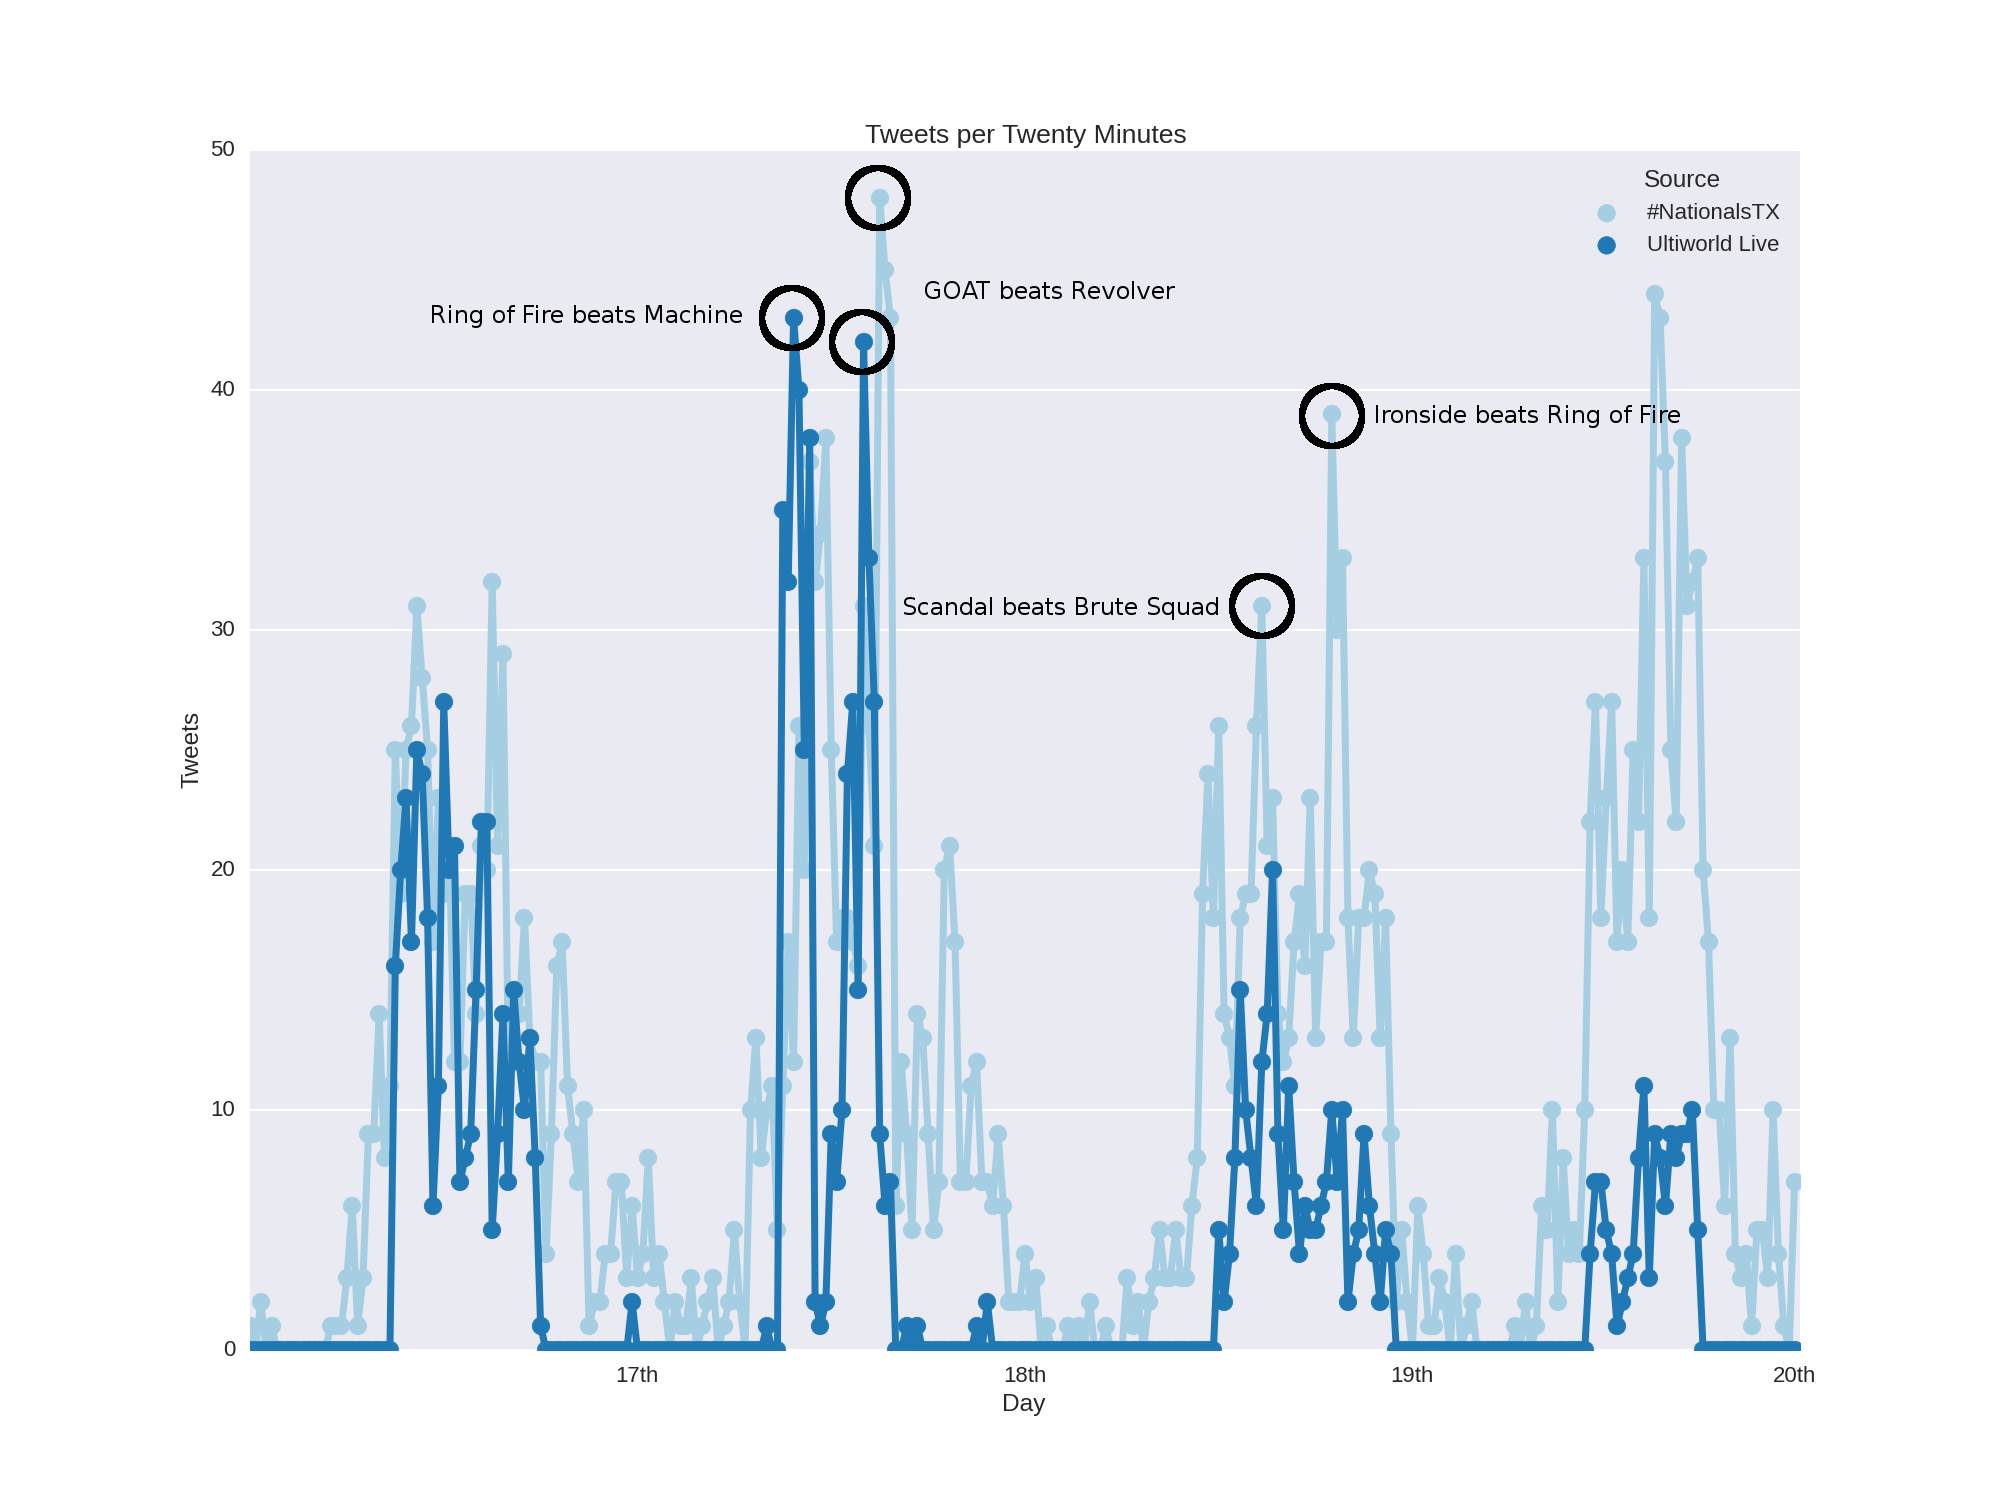
Also you can see how in pool play and the first rounds of the bracket Ultiworld Live has more tweets due to sheer amount of games. But as there become less games and they are closer to the championship, #NationalsTX becomes more prominent as more people watch the games.
Conclusion
Now analysis may be a strong word to use about what I did for this post, but to be honest that had to do with how long ago it was. I plan to take the scripts from this analysis and apply it to tweets from this years college nationals and see if I can do a better, and more timely, analysis. Hopefully this was still interesting though, because I thought it was cool that you could see where big upsets and games occur just by looking at the data.
Markov Bot
One task I didn't finish for this project, because I think it would be better left to it's own post, is a Markov Bot. This would take all the tweets and slice them up to be able to create random sentences or tweets. I still plan to make this and will go more in depth when I do, but an example of this is FiveThirtyEight's Markov Bot that uses the text from their articles.